
Of all the projects that I worked on as part of the Interactive Newsroom Technologies team at the New York Times, I would count the sustained effort on the Election Results loading system as my most significant work and probably some of the best work I’ve ever done. It wasn’t so much a dazzling technical marvel (although there were some innovations I’ve especially proud of) as it was a reliable workhorse, doing its job through primaries and general elections, for federal or mayoral results, with no outages and only one serious bug in production (that it happened on election night 2012 wasn’t great). This page collects some expanded notes on the election night loader, how election nights were at the Times and various pictures I have posted to social media, etc. in the past, now collected here.
Before we begin, I wrote a basic overview of how the election loader works in 2012 that touches on some of the basics of how elections are modeled. It’s worth reading, if you haven’t already. I also touch on how it felt on election night 2008 in my essay on leaving the New York Times
I also want to note that software development is very often a team sport rather than a solo endeavor. Although I will describe many things where I was a primary contributor, I was not the only one working on this code or other related election-related technologies, and I am indebted to my various colleagues in the newsroom who built front-tools, graphics and visualizations, as well as those who coded parts of it with me, helped with testing and helped with hosting infrastructure. This project would not have been possible without the coding help of Jacqui Lough, Michael Strickland, Erik Hinton, Tyson Evans, Derek Willis, Andrei Scheinkmann, Aron Pilhofer, Brian Hamman, Matt Ericson, Archie Tse and Matthew Block, among others I have accidentally ommitted in my list. The core of the loader was created through dedicated pair-programming sessions with Ben Koski, and he certainly helped shape it then as much as I did. I also would like to thank the journalists I worked with, especially the race-calling team of Janet Elder and Rich Meislin (sadly both RIP).
High-level Overview
The Election Loader was a program written in Ruby on Rails that was operated over the years 2008-2014 and enhanced with new functionality during that time. It consisted of routines to fetch election results from the Associated Press (provided via FTP), load them into results tables and publish out static pages based on what changed. These were optimized to run incredibly quickly (mostly through low-level SQL operations on a database), processing 51 states within a minute before beginning the loop again. It also included an admin for editing specific configuration values about candidates and races, and which also included the “Meislomatic” interface for monitoring races and allowing New York Times editors to make manual race calls on election nights.
How the AP Provided Elections
At the time, the Associated Press was the only game in town for getting election results in realtime during elections. They have an impressive operation, with stringers located in precincts across the US calling in results to a central coordination center. They had two tiers of services provided for people who worked with election results: one with a delay of a few minutes for election result changes to show up in the feed and another one (“the dollar sign and two commas” plan as I heard it jokingly described) for the premiere TV networks. More recently, I believe the AP has moved to a RESTful API with JSON, and there are competitors like Reuters and DecisionDeskHQ also providing results, but at the time we were working with it, the “API” was simply an FTP server with a collection of 3 files for every state with results:
- The *candidates file had the names of the candidates. This would likely not change once created for a given election date. Each candidate would have a unique
candidate_id.If a candidate was in multiple races, they would have multiple rows in this table (one for each race) with a single uniquepolitician_id(that also would stay the same for primaries and general elections). - The races table was a collection high-level race information. Each race would have its own unique
race_id. There actually would sometimes be several races for an election: the state-wide totals as well as county-level results. This table would also tell yo how many precincts had reported. - The results table would show the specific results for a given candidate and race, as well as special flags to indicate if the AP had called the race, or if was going to runoff.
And that was it. Three tables are all you needed to describe the current state of an election, but there is a lot of additional context that often needs to be computed based on the information provided: for instance, the delegate counts towards a presidential nomination or how a candidate is faring against their projected outcomes needed for a win. We’ll get to that, but the initial challenge was just how to load this data repeatedly during an election night without running astray.
Key Innovations of the Loader
We were big users of Ruby on Rails from a very early date at the Interactive Newsroom Technologies desk. On the programming side, many of us had come from more verbose statically-typed languages, and I appreciated the cheeky conciseness and mild anarchy of Ruby compared to other languages - I’ve also been using Python for years, but it’s hard for me not to read exhortations like The Zen of Python in anything but a fusty tone compared to Ruby’s “There More That One Way To Do It” ethos and the weirdness of why’s Poignant Guide to Ruby.
One of Rails’ key features for us was its Object-Relational Model (ORM), the library that allowed programming structures to be saved and loaded to a database. Rails used the Active Record pattern, where it would figure out the structures and fields of programming classes by looking at database tables and their structures. This was in contrast to other models where objects and their types would be described in programming languages first and then applied to the database layer. The latter approach is far better for making sure that website form inputs can be validated before being saved into a database, but at the Times, we were almost always being given complete databases and racing to build applications on top of them; the database-driven informality of ActiveRecord was key for making that happen.
Change Detection
Theoretically, we could just have used database utilities to load the data files from the AP directly into our databases and then they would be usable by our application. This seemed rather risky. Although we could use database transactions to rollback changes if an explicit error occurred, what if there were more subtle problems with the data that might not trigger loading errors? For instance, what if a race or result file were missing races accidentally? We would lose all record of them and they would vanish from our results pages. Instead, we decided to load the data into staging tables, run validations on it, and then run SQL commands to copy the staging data into our production tables that served election results. In order to run safely, we would use database transactions to do the copy, so that any error could be rolled back cleanly. But that led to our second concern: how performant would it be to lock millions of rows for database updates every few minutes while we were trying to read from them? What if we could make the update transaction focused on just what had changed?
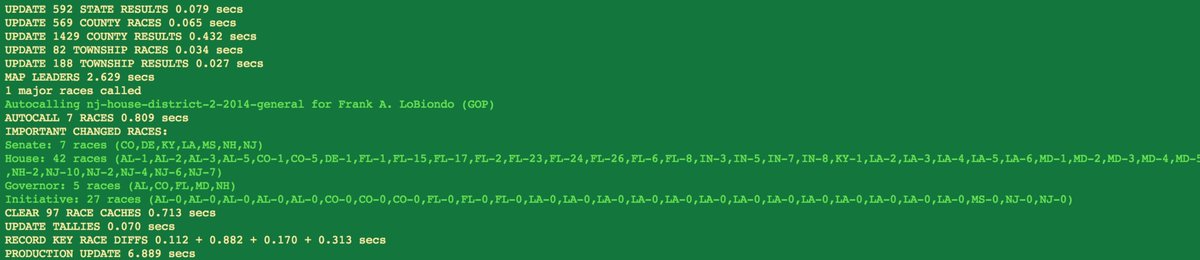
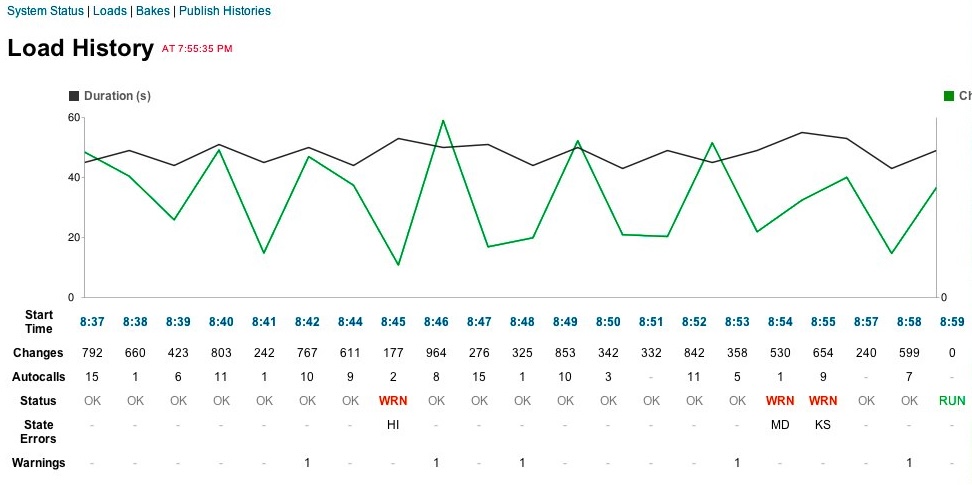
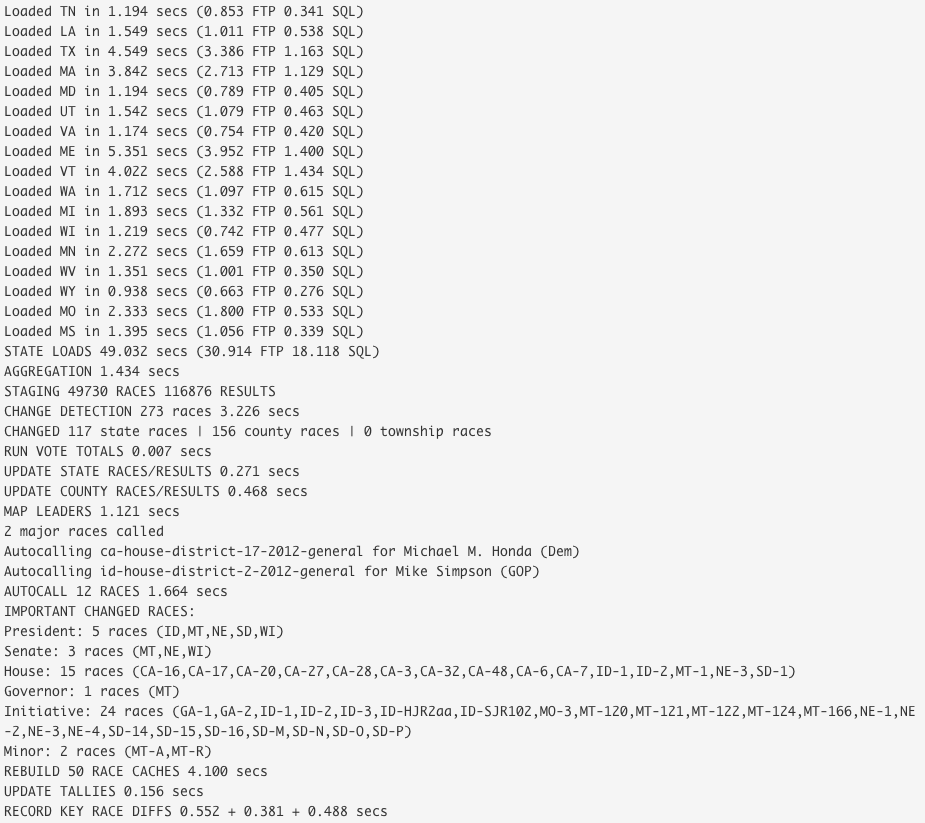
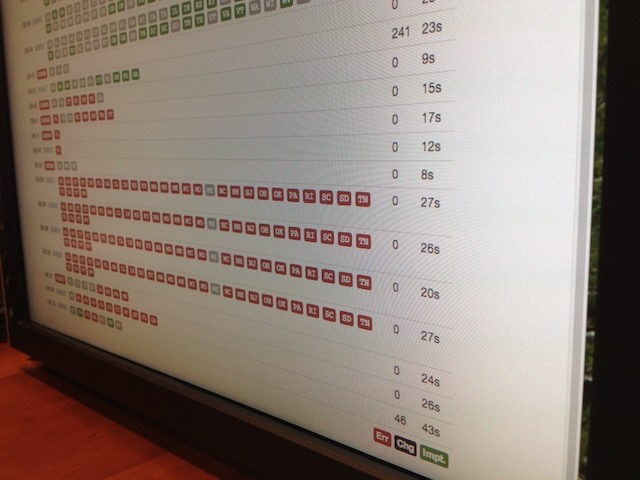
This led to one of the best decisions we made for the entire program: change detection. After we had validated the staging data, our code now ran a change detection step that looked for what races/results were different from what was already in production. Then we just ran code to update the production tables for those that had changed. This meant the updates were remarkably fast and easier on system resources, but it also meant we now had the ability to see what changed during each load! This gave us the loader a lot of new powers:
- Able to conditionally rebuild and rebake results pages and widget based on changes
- Able to create events for things like AP race calls/uncalls that are indicated by a field being set
- Setting up alerts for other newsworthy change conditions like first votes recorded in a race, 100% precincts reporting, delegate allocation changes
- Dynamic updates to AJAX components in our admin to show changes
- Able to efficiently record a sequence of vote totals for any given race over the night
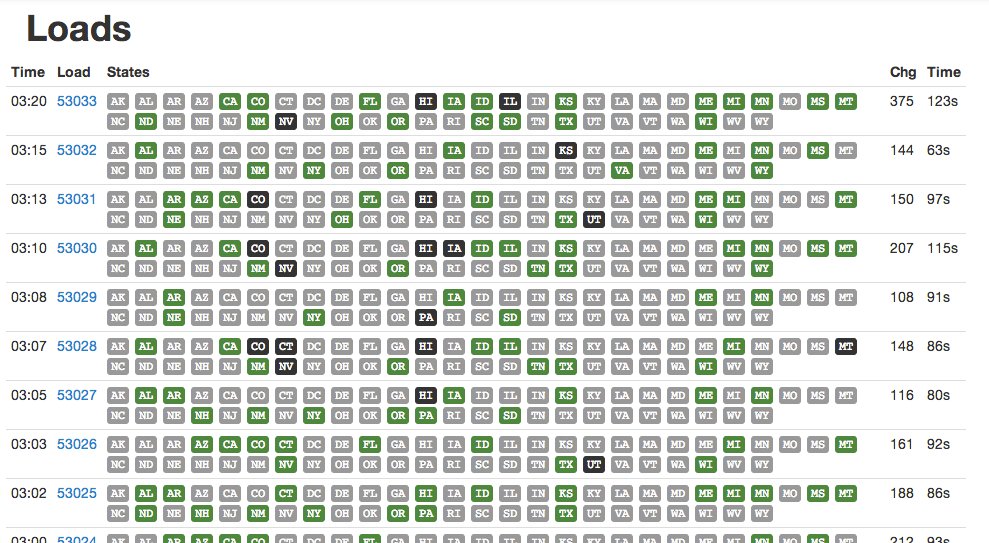
Election tabulation in reality is a continuous process of various results being reported into the AP all the way to AP updating posted files on their servers. From our perspective though, we could think of loading as a quantized process - fetch, load, update, repeat - with each load cycle like a tick of the clock. Change detection is what let us see what changed in each tick so we could take action on it.
Multithreaded FTP Processing
I may have mentioned it a few times, but the AP election files in the 2000s were available via FTP, a file-transfer protocol that had its heyday in the 1980s. Furthermore, on a general election night there could be up to 51*2 (race, results) = 102 files to fetch every load so we could identify what had changed. Over a single serial connection, it could take minutes alone to grab each file before we even started loading. We needed to optimize it. Luckily multi-threading worked well for this situation, and I determined that the AP had a collection of multiple FTP servers serving requests. After some trial-and-error, I determined that if I had 3 loading threads running at once I could parallelize pulling down the files I needed and also not overwhelm the servers for everybody. I also could use file info to determine what files had changed on the server rather than pulling all of them down (although I did periodically pull all of them down on regular intervals). This meant that file retrieval took a matter of seconds and I could run loads around once a minute, even on a general election night.
Because there were multiple FTP servers in use by the AP and clock skew was an issue, I decided to not look at timestamps in my loading scripts to determine files to load (instead it looked a size changes, etc.). This proved to be a huge mistake on the general election night in 2012, when one of the AP’s FTP servers was not being correctly updated like the others, thus making it appear like it was a few minutes behind the other servers. The result meant that the election results seemed like they reverted to an earlier time and then forward again depending on FTP server they were retrieved from. Oops! I was able to quickly deploy a fix to look at the timestamp once I identified a problem, but it’s not enjoyable to write code when you have several senior political editors breathing down your neck!
Incidentally, I created Times Haiku because of the minor depression I fell into after the election due to that bug.
Customization
One other thing we had to do early when building out our election loader was adding the ability to customize various aspects of the data to match Times editorial standards. This could mean simple things like how we’d want to render the name of C. A. “Dutch” Ruppersberger or other things like the order in which we’d want candidates to appear (especially important in races like the New Hampshire primaries where dozens of candidates will run). We had customization tables of various types with an admin so that newsroom editors could edit them. These customizations would then be applied to the data after loading/change detection and before it is copied into production tables.
While I’m talking about Times style, it’s also important to note that there is a specific style guide that we coded our app to follow when baking out results. For instance, we computed/displayed vote percentages to 1 decimal place. In a related vein, we displayed a race as “100% reporting” only when every single precinct had reported. Otherwise it would be displayed as “>99% reporting.” There are a few other rules in there that I’m probably forgetting, but it’s important to have a data style guide (like this one for ProPublica) if you plan to report on data to a nontechnical audience.
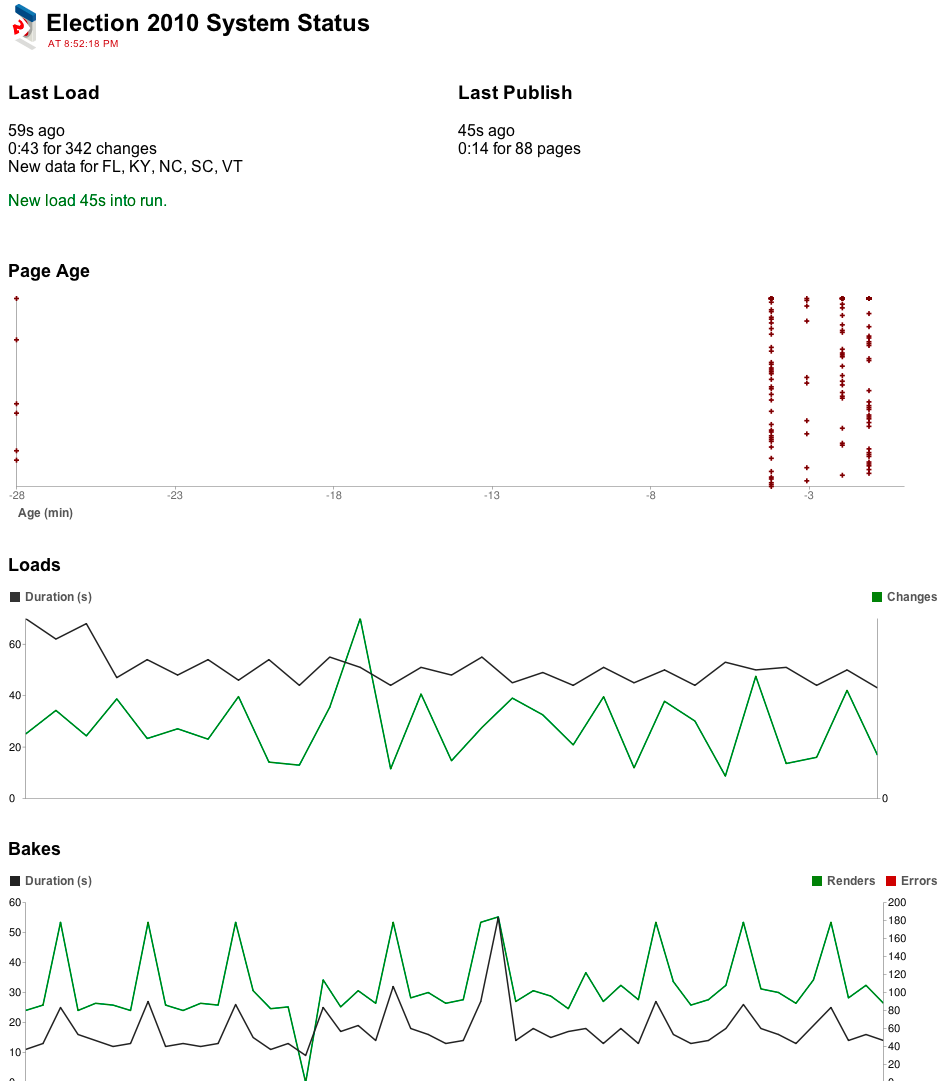
Baking Pages
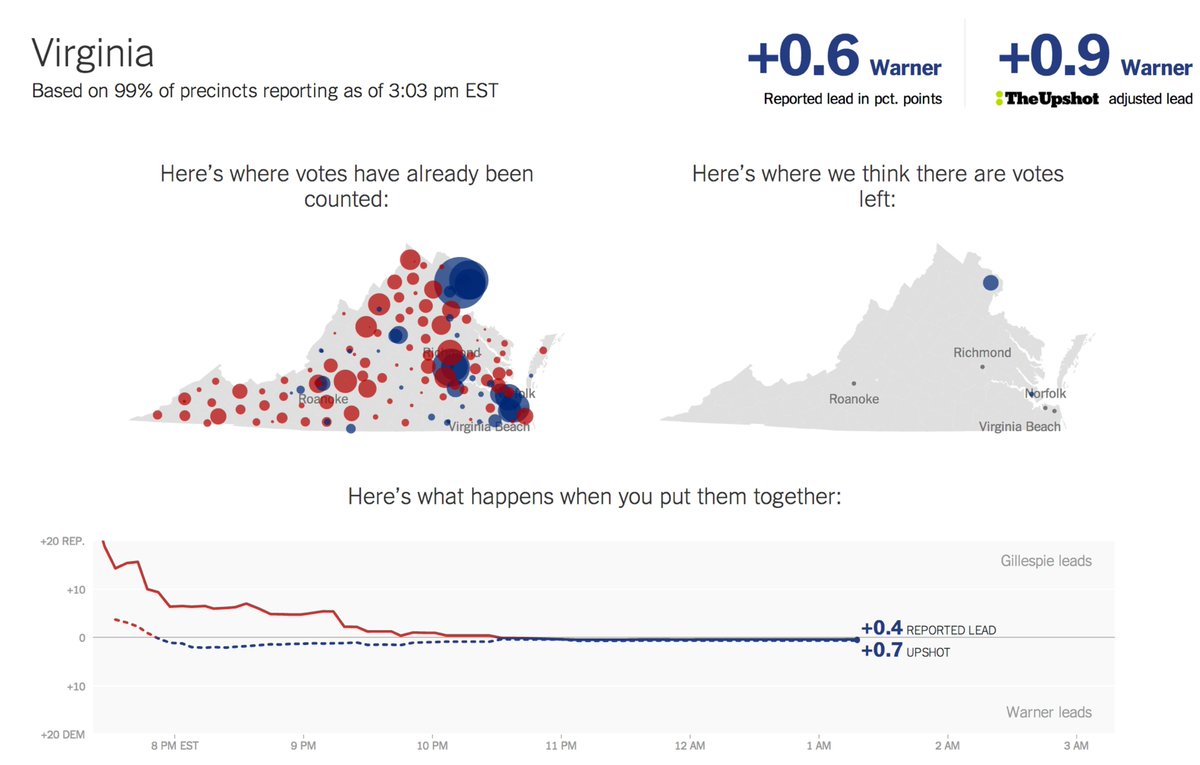
One of the nice things about election reporting is that while the traffic can be huge, you can show the same page to everybody. We had already had experience using the reverse proxy cache Varnish to serve cached responses to users without hitting our back-end servers, but there was always the risk that our own caching servers could melt down under high load. Instead of caching our servers, we tried a “baking” model where we would bake out a set of static pages to Amazon S3, a service for hosting static content that supports massive numbers of simultaneous requests. All we had to do was supplement the existing cycle to fetch, load, update, bake, repeat and we could just bake things as part of loading. And, because we had change detection, the loader only had to rebake pages/elements that contained races that had changed during that specific load. This could mean a combination of saving out static items to S3 or telling Varnish it can clear the cache for certain pages.
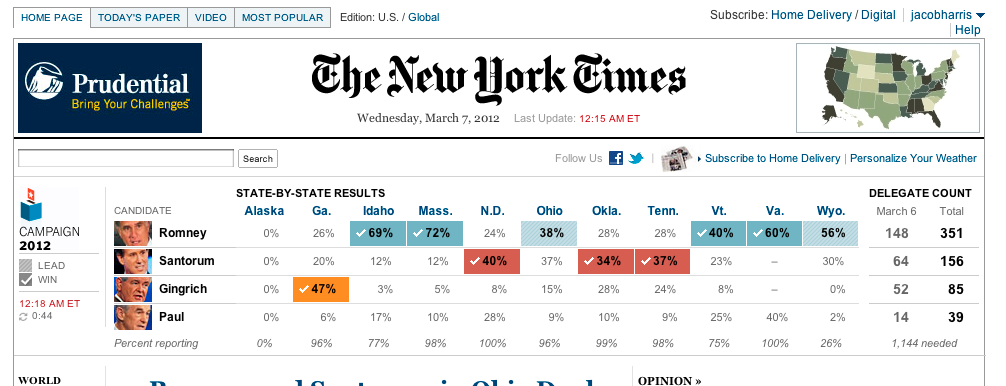
We used baking extensively. Not just to create whole pages on elections.nytimes.com, but also for components and widgets that appeared throughout the site. We called the ones on the homepage either “the Jim” or “the Mini-Jim” after Jim Roberts, a politics editor at the Times. In 2012, baking was also integrated with our system for pushing data to browsers. For one election, I even made a special file in Adobe Illustrator format that could be baked with data to regenerate a map that would appear in the print edition (allowing them to grab the current version exactly when they needed it at press time).
Race Slugs
This is one other thing that took a little while to figure out but then seemed blindingly obvious in hindsight. As I mentioned earlier, the AP had IDs for every race. However, these IDs would not necessarily be stable and available before every race and there were even times where they reused the same race_id for two different elections. They were meant to be unique enough for joining among tables in a database but not durable enough to be used to find races. The alternative was to use a combination of other fields to find a race. For instance, we could use the fields {race_type_id: 'G', office_id: 'H', seat_number: '2', state_id: 'NY'} to find the general election race for the NY-02 House district. This gets a bit unwieldy though, and unfortunately, there are many weird exceptions out there for various states. For instance, Ohio’s primaries are technically 16 races, selecting a delegate for each of its congressional districts as well as a general at-large delegate for the entire state. The Republican primary can be found with the combination of {state_id: 'OH', office_id: 'P', race_type_id: 'R', seat_name: 'Delegate-at-Large'} which is a very different than the one for NY {state_id: 'NY', office_id: 'P', race_type_id: 'R'}, for instance.
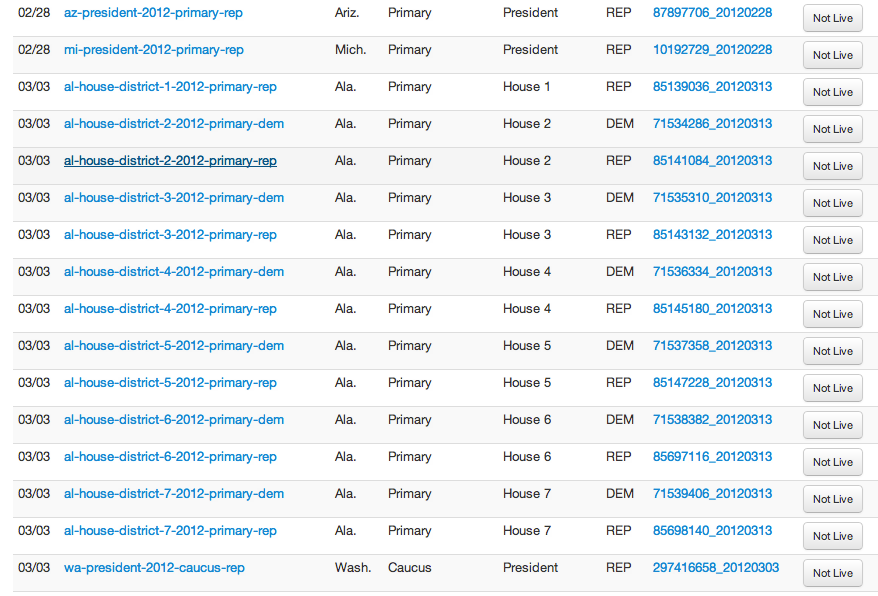
Which is the biggest problem with this approach. Not only is it verbose, it’s inconsistent; looking up races this way would mean that each coder or page designer making those requests would have to remember the proper parameters for each of the races they needed, and the chances of making mistakes would be unacceptably high. What if we could replace the nuances and exceptions of how elections are specified in the real world with a model that is consistent? Race slugs are the answer. Under this approach, we defined a naming convention of race slugs - strings that could be used to reference a single race like oh-president-2012-primary-rep or ny-house-district-2-2012-general for instance. We then implemented a mapping table with a corresponding admin to define how individual slugs were mapped to values in the race table. At the beginning of an election night, when we loaded all the candidates and setup the races for the first time, we would run a process to map the slug to the specific races and their race_ids for that election. If a slug didn’t match anything or more than one race, it would raise an error and we could check and adjust until it matched exactly one race. Then we could use the slug to find the races and map races back to the more readable slug when we needed to display internal messages for debugging.
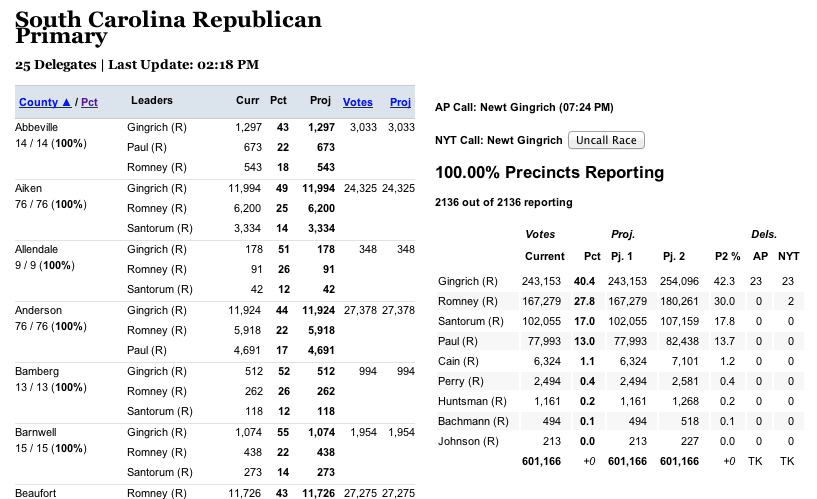
Race Calls
The AP election result schema included their own race calls as part of their reporting. A race call is a newsworthy event, since it often triggers an alert on the homepage and possibly a recalculation of delegates won or electoral points awarded. Calls are significant enough that we need to record the moment in a persistent way as its own events. So, we made a separate calls table to record when the calls happened. How did we figure that out? Change detection! If the call flag is set in the staging table but not in the production table, that means a call was made between this load and the one before and we can record a new call! The inverse is also sometimes important, because that means the AP retracted a call, and that also can require a news alert or recalculation.
The Times generally would follow the AP’s race calls, but they also wanted to make their own calls independent from the AP. Using the calls table meant for races we wanted to autocall, it would create two different call records on an AP call: one for the AP call and one for an NYT call. But, if we had a race set in our admin to be manually called, then the NYT call could be created at any time (the interface for this was called The Meislomatic in honor of Rich Meislin, its primary user). We also used this table structure for the general election in 2008 to record calls made by other news sources like CNN and the networks (the key was a panel of volunteers in the newsroom checking those sites for calls and entering them via a custom admin screen). We could even use these calls to compute the Electoral College counts reported by the AP and other news organizations in addition to the Times.
Electionbot
In the early days of Interactive News, we were using the Campfire and Basecamp apps for coordination and communication. But in 2014, the Times switched to using Slack, which created some exciting new possibilities for keeping track of races. In the early days, I sometimes would monitor election loading on off-hours or random primaries (like Samoa) by using ssh on my phone to connect to the election servers where I could monitor the logs. This was cool but a bit unwieldy, since it required that I kept a connection open to the server, and it took a little bit of time and effort to reconnect every time I disconnected.
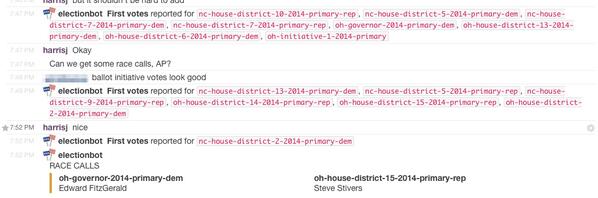
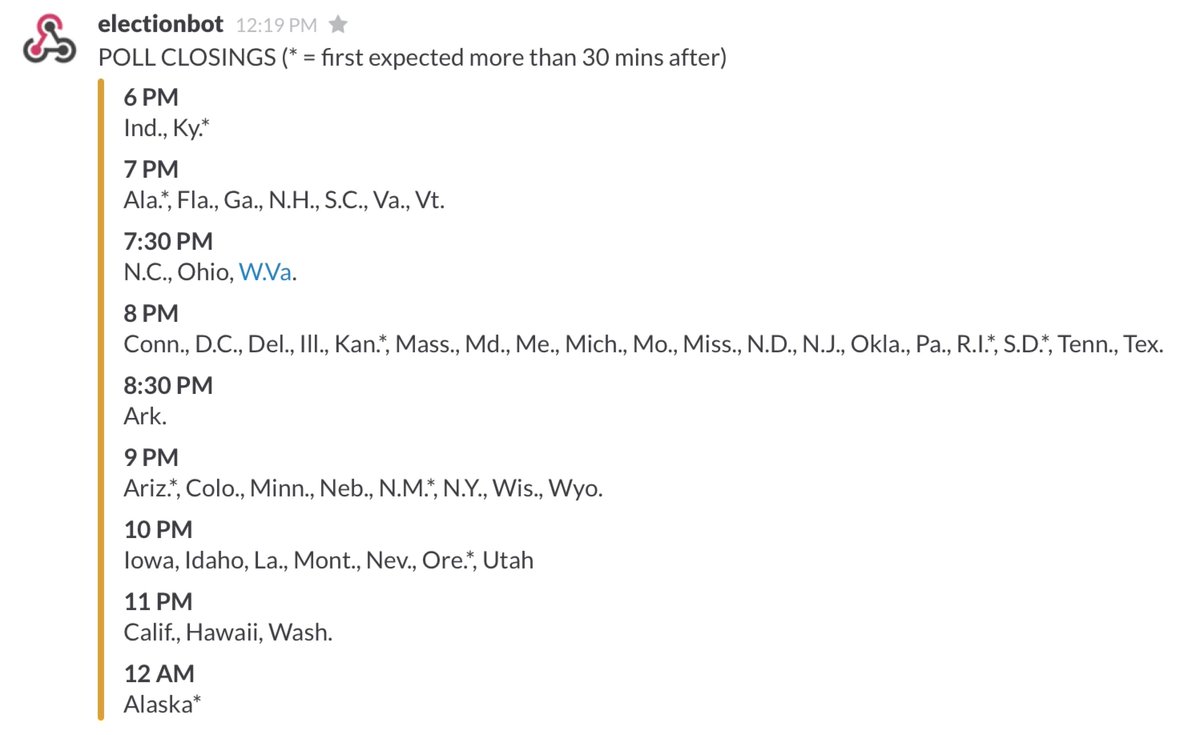
One of the nice things about Slack is that it supported something called “webhooks,” which is a programming convention for the software to interact with other systems by making short connections to remote web URLs with data (these were callbacks aka “hooks” but on the web, so webhooks). Slack supported two types of webhooks: we could create an endpoint on Slack which could receive messages from the outside and post them into the channel. And there was also an option to implement outgoing webhooks, where a command prefixed with a / could trigger a request and then display the response in the channel. We used both of these extensively, with the election loader posting in events like race calls or first votes to the Slack channel (using the race slugs as identifiers) and also we could type commands like /poll closings and get a nicely displayed list of poll closings for the night. For more details and examples of the code, see my 2015 article Thank You, Electionbot. These days, this kind of programmatic integration of server infrastructure with communication tools is called “ChatOps,” but back then we simply just called it cool.
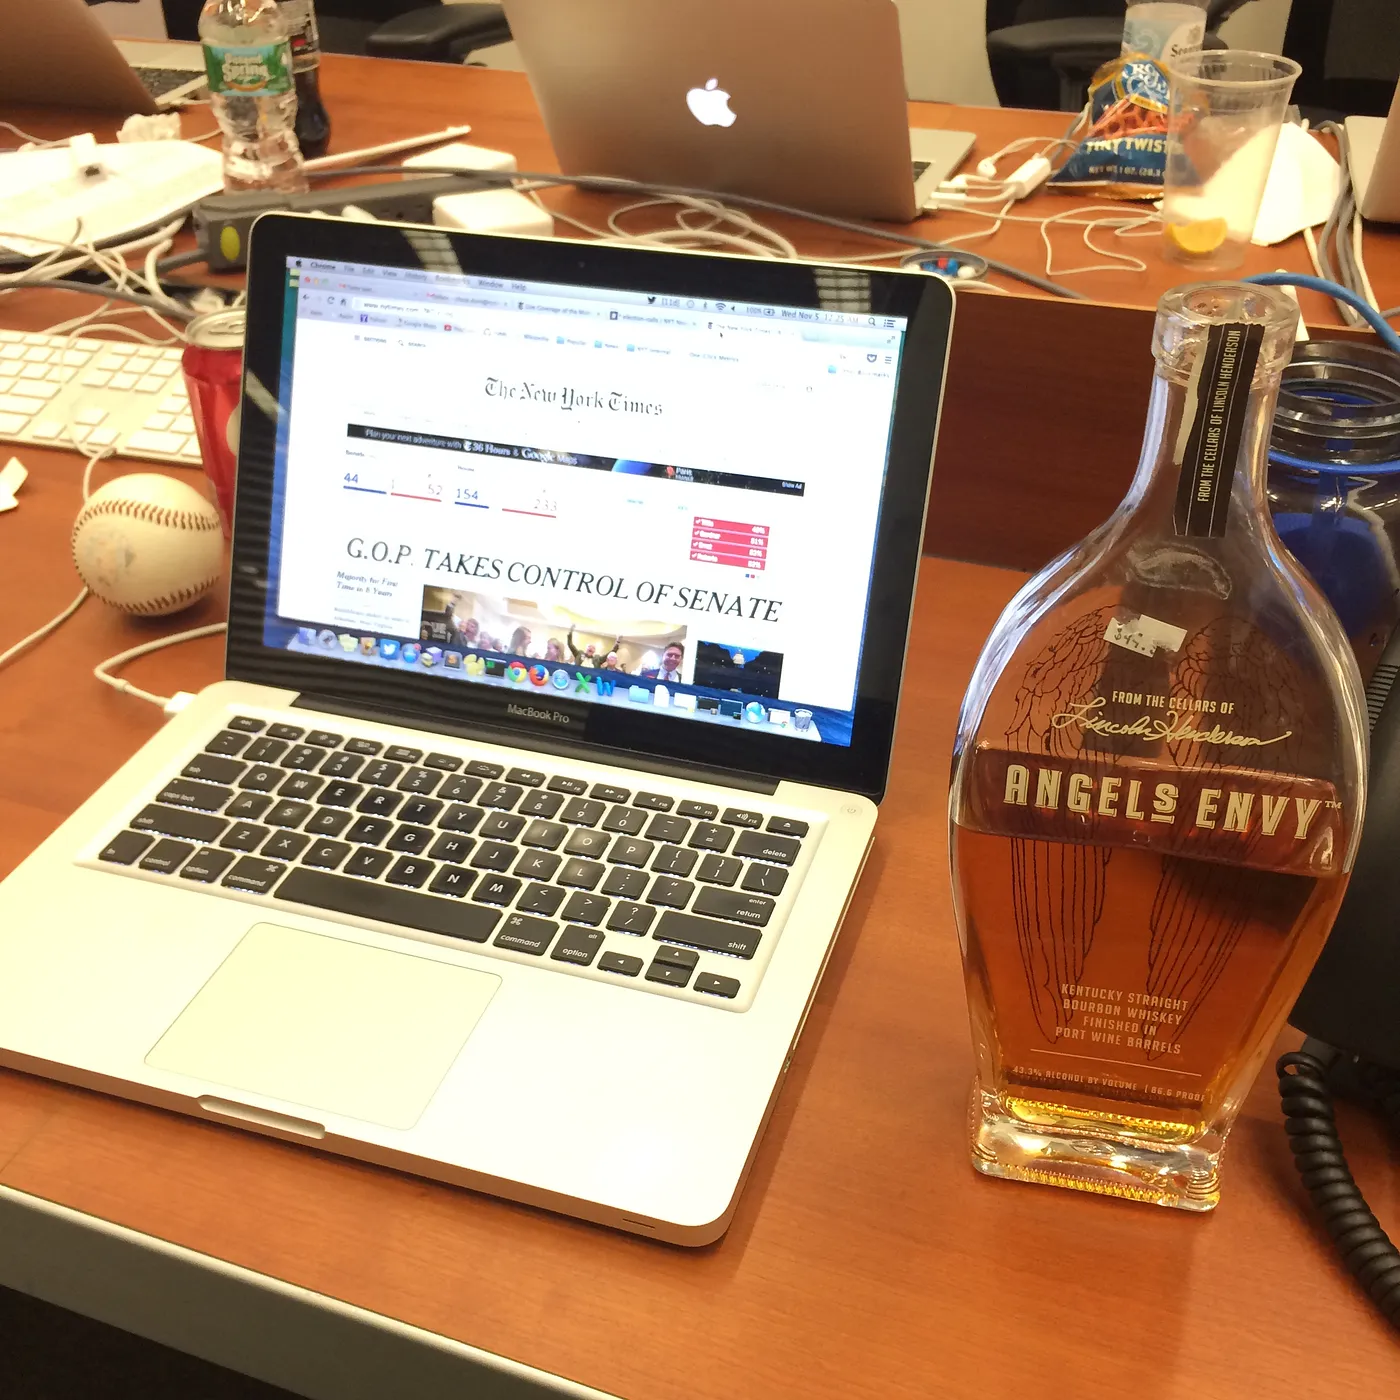
The Flow of a Typical Night
I often described election nights as hours of tedium punctuated by moments of terror. This is a bit of an exaggeration - apart from that terrible night in 2012, everything else worked smoothly - but it is true that the tension would usually ratchet up a few minutes before the polls closed and during that interval where we waited for first votes and race calls to come in for a given state before dissipating and then ratcheting up again. It was sometimes important to set alarms just to know when the best time to take a bathroom break was.
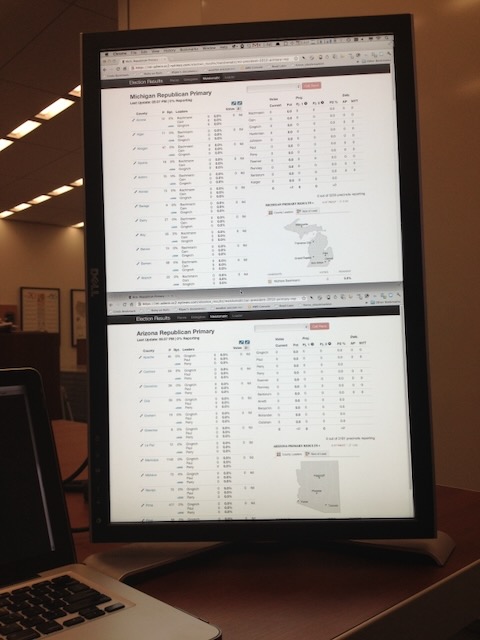
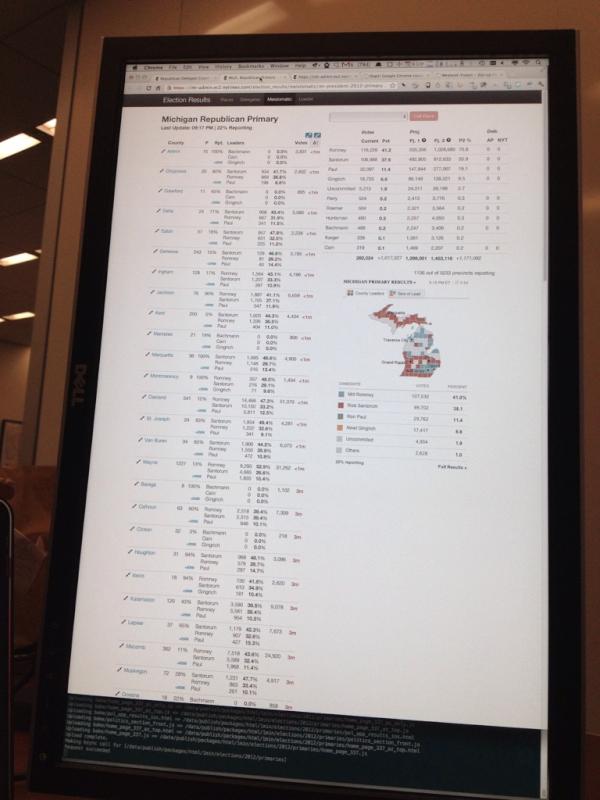
We would usually start our loader in the early afternoon to setup the races and map the slugs when the AP announced that the syatem was all zeroes. Then, it would be figuring out where to order dinner, watching the loader and seeing the data come in. I liked to setup at least one monitor in a vertical orientation so I could better see the admin and sometimes stack two races on top of each other. I also always wore a tie, out of some superstition.
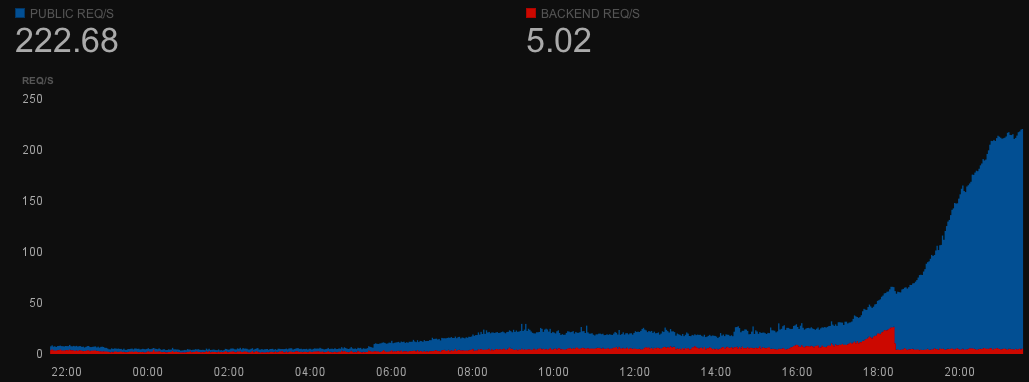
General elections and big primaries like the early contests and Super Tuesday were exciting in the newsroom. It usually started with a small panic attack because I would load the zeroes and see that there were somehow votes in there before remembering and cursing the residents of Dixville Notch for their early voting gimmick. Then, it was just moving our servers, figuring out seating plans and talking about our expectations for the evening. Once the results started coming in for real, I was usually in a zone for hours, watching the code do its job and the pages fill with content. I likened it to a space launch, we would finally see how various interactives and designs unfurled with the real data of elections (as opposed to our various tests), and it was always amazing to see how the traffic numbers would go up, the homepage editors would tweak the layouts and the reporters would consult with editors and file their stories. This pace would usually continue until the race was called and some remaining states came in, the acceptance and concession speeches wrapped and the paper was laid out for the presses. I often would stay on for a few more hours after that - Alaska and Hawaii didn’t close their polls until 11pm and midnight on the east coast respectively - just to make sure things were running before putting the loader onto a slower cadence, to catch a car service home at 3am.
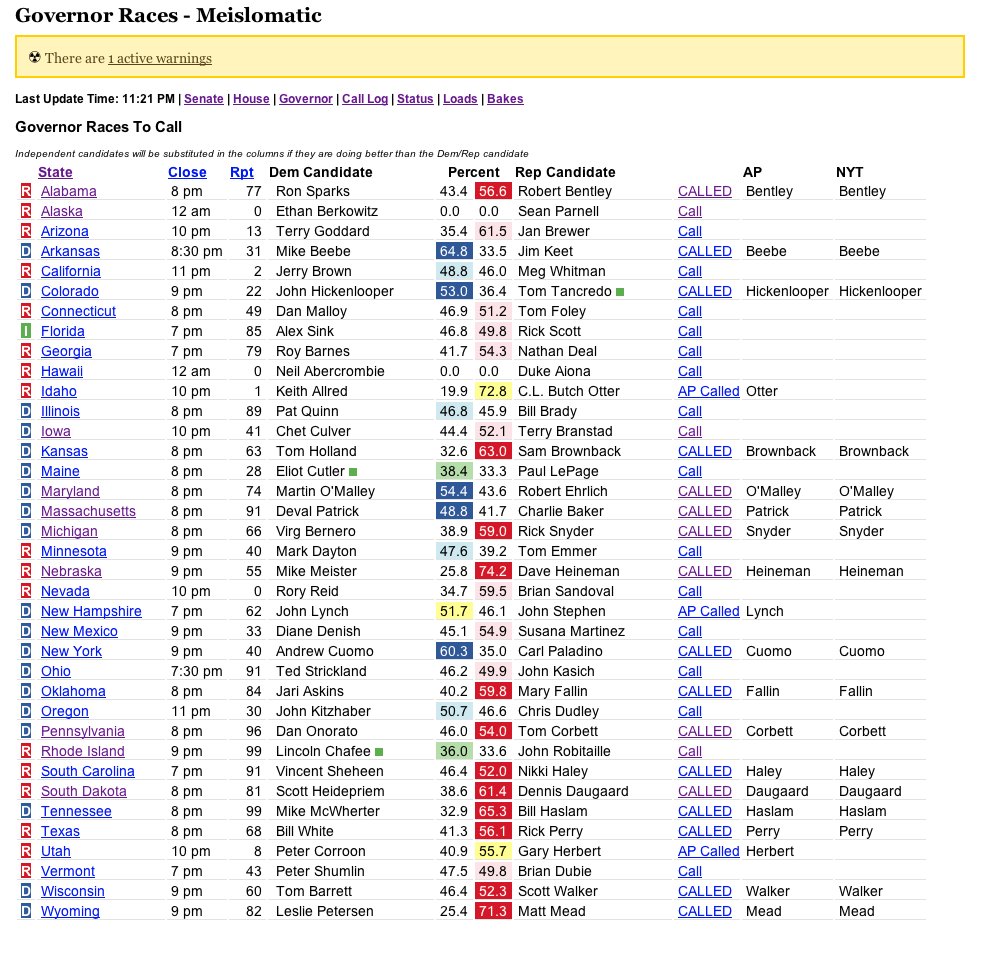
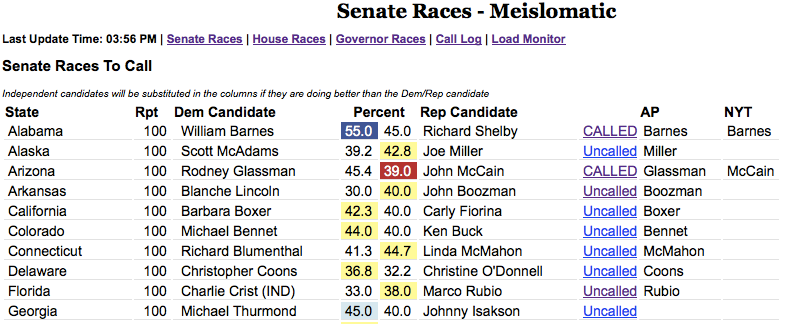
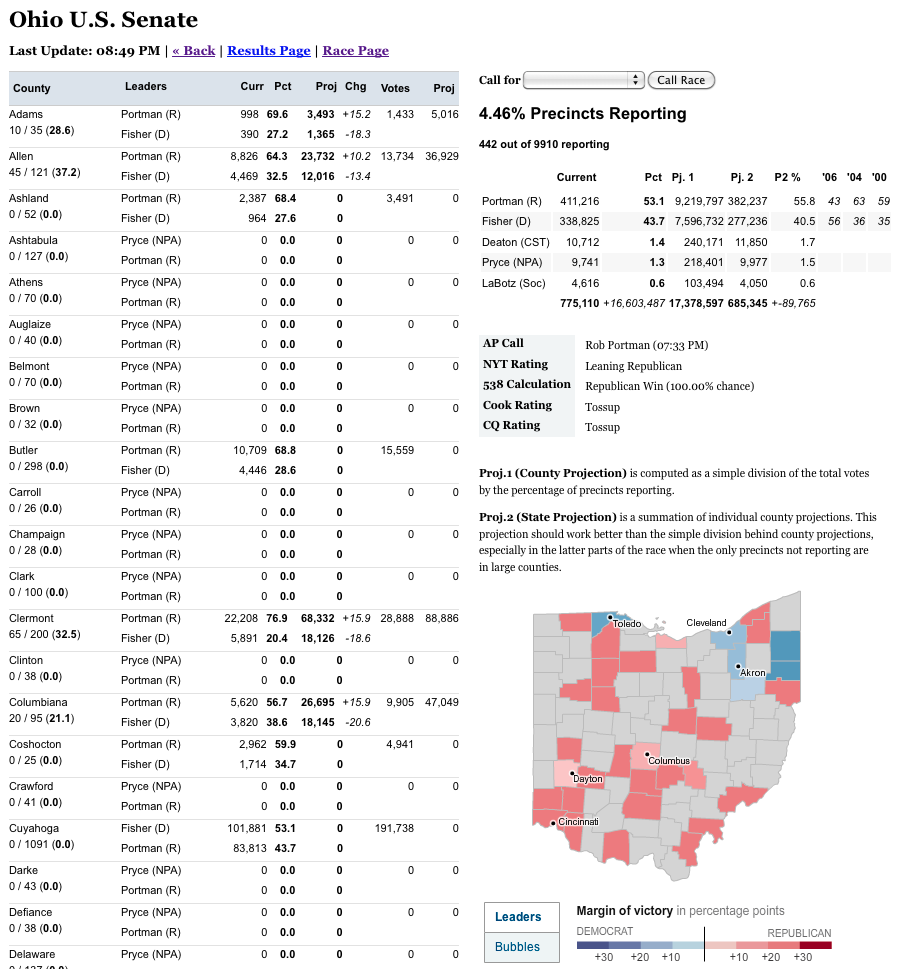
The Meislomatic
I also spent a fair amount of the night running between floors of the newsroom with my laptop. The Interactive Newsroom Team and the Graphics department were located on the second floor of the building and below the main floor of the newsroom (I called it the Basement of News sometimes). But I usually spent most of the night upstairs on the third floor in the middle of the politics desk so I could be there to support the race calling team of Rich Meislin and Janet Elder in case they had any questions or noticed problems on the special race-calling admin I had built for them called the Meislomatic.
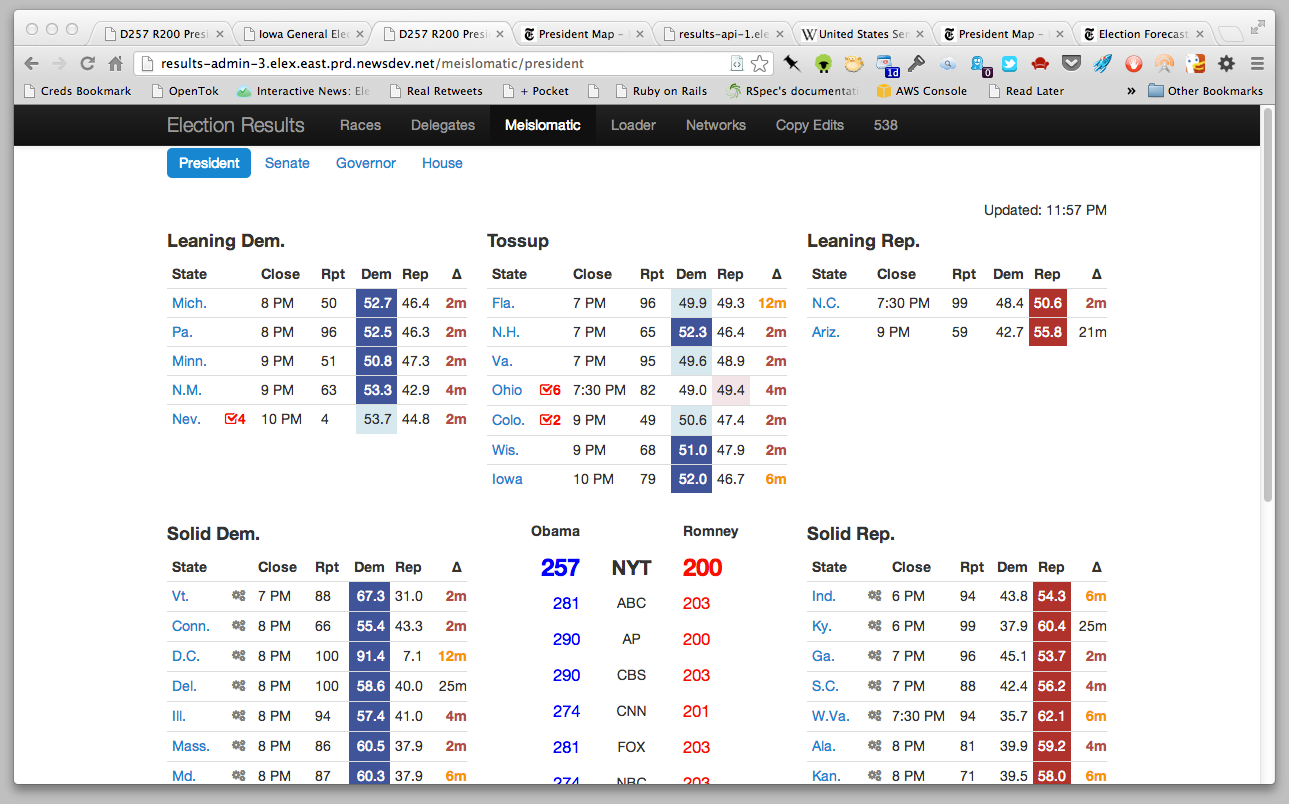
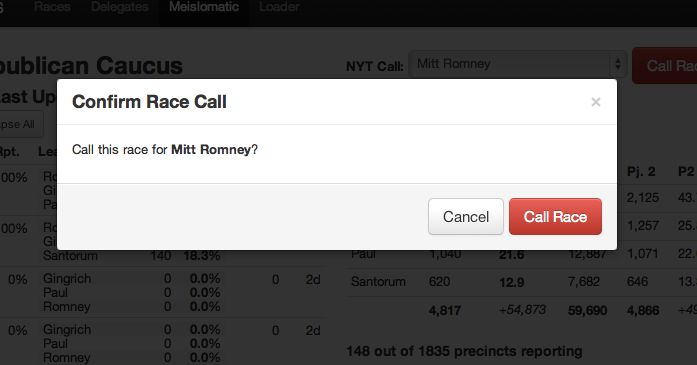
As I mentioned earlier, the Times politics desk wanted to make its own calls for certain races rather than relying on the AP. This usually meant every state in the Presidential election and primaries, as well as key congressional and gubernatorial races. To help them keep track of all that, I built a series of custom admin interfaces to our election loader (we ran command-line scripts to do the loading, but it was also a web app in Rails too) that gave specific information that the call desk needed about the states of races. These screens would dynamically update their counts when they changed with yellow flashes showing the fields that had change (another use of change detection!). The other key part of the interface was a big red CALL RACE button that the person making the call could press once they had selected who had won that race. At Rich’s insistence, I added a dialog popup that said “Are you sure?” before the race call could be processed. At the time, I thought this was overly cautious, until the night of the 2008 election when Rich let me call the result for California and I started sweating anxiously when I thought about how this call would show up on the homepage and if I messed up it would be a minor story in the Gawker or the Observer titled “Times Flubs California” or something. He was right. It needed that popup.
What Next?
I left the Times in May 2015. After nine years in journalism, I was ready for something different and I went to 18F to start my career in Civic Tech. By that point, the state of technology used by the AP had also progressed. The FTP servers were soon to be deprecated and replaced by a more modern API. There was increasing competition by other media organizations to provide the results, and some states were improving in their ability to provide vote totals in realtime via their board of elections sites. The Times also wasn’t as interested in going it alone as it had been in the past, and it started building a new election loader as open-source in collaborations with a few other online newsrooms. My system was mothballed in 2015 by its successor. That system was archived in turn in 2023. I’m not sure what they’re running now, but there still is some sort of loader running to pull in election data. The code might have changed, the developers are very different from my day, but the general concepts remain the same. My loader was just the first in a sequence of technical innovations in how the Times provides election results.
Some Other Images of the Meislomatic

Every State is Weird
Finally, here are the slides for a lightning tale I gave on all the special peculiarities of how each state conducts elections titled “Every State is Weird”. Enjoy!