The story of the Interactive Newsroom Technologies team started with a tragedy.
During the afternoon rush hour on 8/1/2007, the I-35W Mississippi River Bridge in Minneapolis collapsed, killing 13 people and injuring hundreds. Within the New York Times, the Computer-Assisted Reporting team had a database of bridge inspection data for every bridge in the US available within hours of the accident. There was a suggestion that the NYT should make a searchable site that would allow users to see the inspection data and condition of bridges near them as well as the most neglected bridges in the US comparable to the collapsed span in Minneapolis. But, the only options to do would be to create either a Flash app and some sort of custom data backend in the Times’ antiquated custom programming language or to individually publish tens of thousands of pages for each bridge in the Times’ CMS - in short, there was no good way to build an interactive application for news in the Times’ technology stack. It was time to make one.
At the time, I was working for the digital side of the newsroom as a Senior Software Architect, primarily on a project to port over some functionality for things like parsing session cookies from the Times’ custom programming language used on its website to more modern languages like PHP or Ruby. I also was running the @nytimes twitter account, but I was also interested in applying technology towards journalism. The newsroom, in turn, had some staff who were interested in applying technology to the Times. There already were strong teams inside of Graphics, Multimedia and Computer-Assisted Reporting, and I had met the journalist Aron Pilhofer and Matt Ericson a few times already - once when we were at a Google Dev Day event in Mountain View and also once when I crashed an election planning meeting to argue for greater digital integration into how we would report the 2008 elections. We’d already been talking about next steps, so when the moment finally arrived, we were ready to go. As the absurdly-titled coverage “The New Journalism: Goosing the Gray Lady” described it, things came together rather quickly from there:
‘It was surprisingly easy to make the case,’ says Pilhofer, describing what he calls the ‘pinch-me meeting’ that occurred in August 2007, when Pilhofer and Ericson sat down with deputy managing editor Jonathan Landman and Marc Frons, the CTO of Times Digital, to lobby for intervention into the Times’ online operation-swift investment in experimental online journalism before it was too late.
‘The proposal was to create a newsroom: a group of developers-slash-journalists, or journalists-slash-developers, who would work on long-term, medium-term, short-term journalism-everything from elections to NFL penalties to kind of the stuff you see in the Word Train.’ This team would “cut across all the desks,” providing a corrective to the maddening old system, in which each innovation required months for permissions and design. The new system elevated coders into full-fledged members of the Times-deputized to collaborate with reporters and editors, not merely to serve their needs.
To Pilhofer’s astonishment, Landman said yes on the spot. A month later, Pilhofer had his team: the Interactive Newsroom Technologies group, ten developers overseen by Frons and expected to collaborate with multimedia (run by Andrew DeVigal) and graphics.
I was one of the staff who came over from the digital side alongside a few transfers in the newsroom and some new hires as well. And that’s where I remained until I left the Times in 2015 (I did move down to DC in 2012, so I did eventually change my desk). I somehow avoided being in any media profiles myself (note from future me: stop being so modest and shy!), but I did play my part in many projects and the culture of the team.
Our Technology Stack
As I mentioned above, the Times website was running a custom but limited (e.g., it didn’t support nested hash tables, because the two developers felt nobody needed them) programming environment with similarly constrained connectivity to backend data sources. To be fair, given the high volume of traffic hitting the Times even then, it made sense to be careful about technology choices, especially when you had to customize responses for each user (in the form of personalization and ad-targeting). But, it also profoundly limited what developers could build: both in what the language itself supported and a lack of third-party libraries. And this was the middle of the Web 2.0 era, there were now a lot of choices to use for web applications!
We resolved early on to use Ruby on Rails to build code for Interactive Newsroom Technologies. At the time, many of the other newsrooms with interactive components were using the Django framework, originally developed for use at the Lawrence Journal-World newspaper in 2003-2004, so why did we pick Rails? For a few reasons:
- It was also a framework for rapid web development (extracted from the Basecamp product), but slightly less opinionated than Python and remarkable metaprogramming support
- NYC had a very strong Ruby developer community in the NYC.rb group
- Rails’ ActiveRecord ORM library was different in that it looked at the database schema to figure out the fields and types of Ruby objects loaded from the database. This was very useful when you were handed a complete database by the Computer-Assisted Reporting team and needed to make an interactive for it
- A bunch of the developers had been using it for personal projects and just thought it was neat
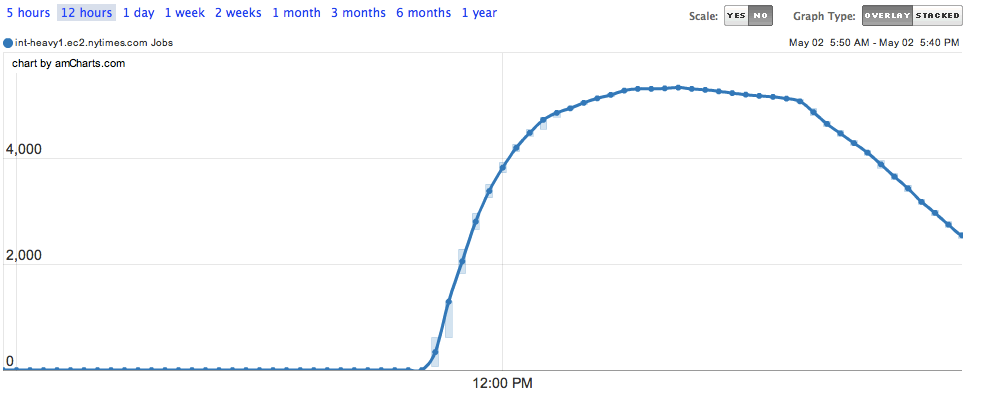
We were also the first team within the Times to use Amazon Web Services. Since we were organized out of the technology side of the newspaper, we were told that we would need to deploy applications using their approved mechanism. In this case, it would mean serving the application from an older version of Solaris x86. To deploy, we would need to create patch files and then give them to the sysadmins for them to push to servers on a regular patch cycle. Or, we could put AWS on a Purchase-card, spin up our own EC2 instances and then just deploy to them at any time we wanted to with Capistrano. You can guess what we did, but I did for a few days to make the Solaris x86 thing work.
One of the most important things we did early on was getting approval to run our own subdomain projects.nytimes.com. This allowed us to avoid having to embed/route our traffic through the main site which was a relief to both the CMS/regular site team and for us. This also is what let us pick our own infrastructure, but it also meant that we were responsible for uptime and on-call to make sure it didn’t go down. It also meant we had to write out own code to make it look like part of the regular site. My coworker Alan McLean made a frame in CSS/HTML to put around our content to make it look like a Times page. Luckily, I had already ported some other special code like session cookie parsing to PHP so I could also make versions in Ruby too. We launched with a few EC2 servers and a load balancer.
Later, we built out our infrastructure to be more scalable. We added Varnish as a reverse proxy cache to make sure we could handle huge spikes in traffic. We switched out web server over to nginx and then built out on top of a custom infrastructure-as-code system that we called Red October. We also had a few on-premises Linux boxes under some desks for stuff that was too sensitive to put in the cloud. The first one was a random PC with a cheap and shiny black plastic exterior that we all called Jeff Vader because of the Eddie Izzard “Death Star Canteen” bit. Its brother was Chad Vader.
Notable Projects
There were dozens of us in Interactive News Applications at some points, so we often had different people working on different projects at the same time. We also had situations where people worked on projects at the same time (some with urgent deadlines, some that were slow-burning). And there were also regular maintenance tasks to upgrade old apps, improve our infrastructure, patch servers. We didn’t really do agile, but agile isn’t really designed for large portfolios of many small applications.
Here’s a roundup of some notable projects I enjoyed working on. These are just the ones that I worked on in some way, and there are many great projects that Interactive News did that I wasn’t involved with. Many of these links are probably broken or will break at some point in the future. It pains me still that it’s easier to read newspapers from 100 years ago than it is for interactives from 15 years ago. I wish we had spent more time in the early days figuring out how to properly archive our content when it was done. But we were moving fast like a startup and trying to show what we could do. And we did a lot!
NFL Playoffs 2008
Our first project was an interactive app we built for the 2008 NFL Playoffs that launched publicly on January 8th, 2008 and contrasted the offense-defense patterns of different playoff matchups as the NFL playoffs progressed, with a different page for each game. It was also implemented in Ruby on Rails 2, according to a tweet of mine. Unfortunately, it ran on a custom domain 2008playoffs.nytimes.com and now it doesn’t work. Ah well, as I was saying about how hard it is to preserve digital projects…
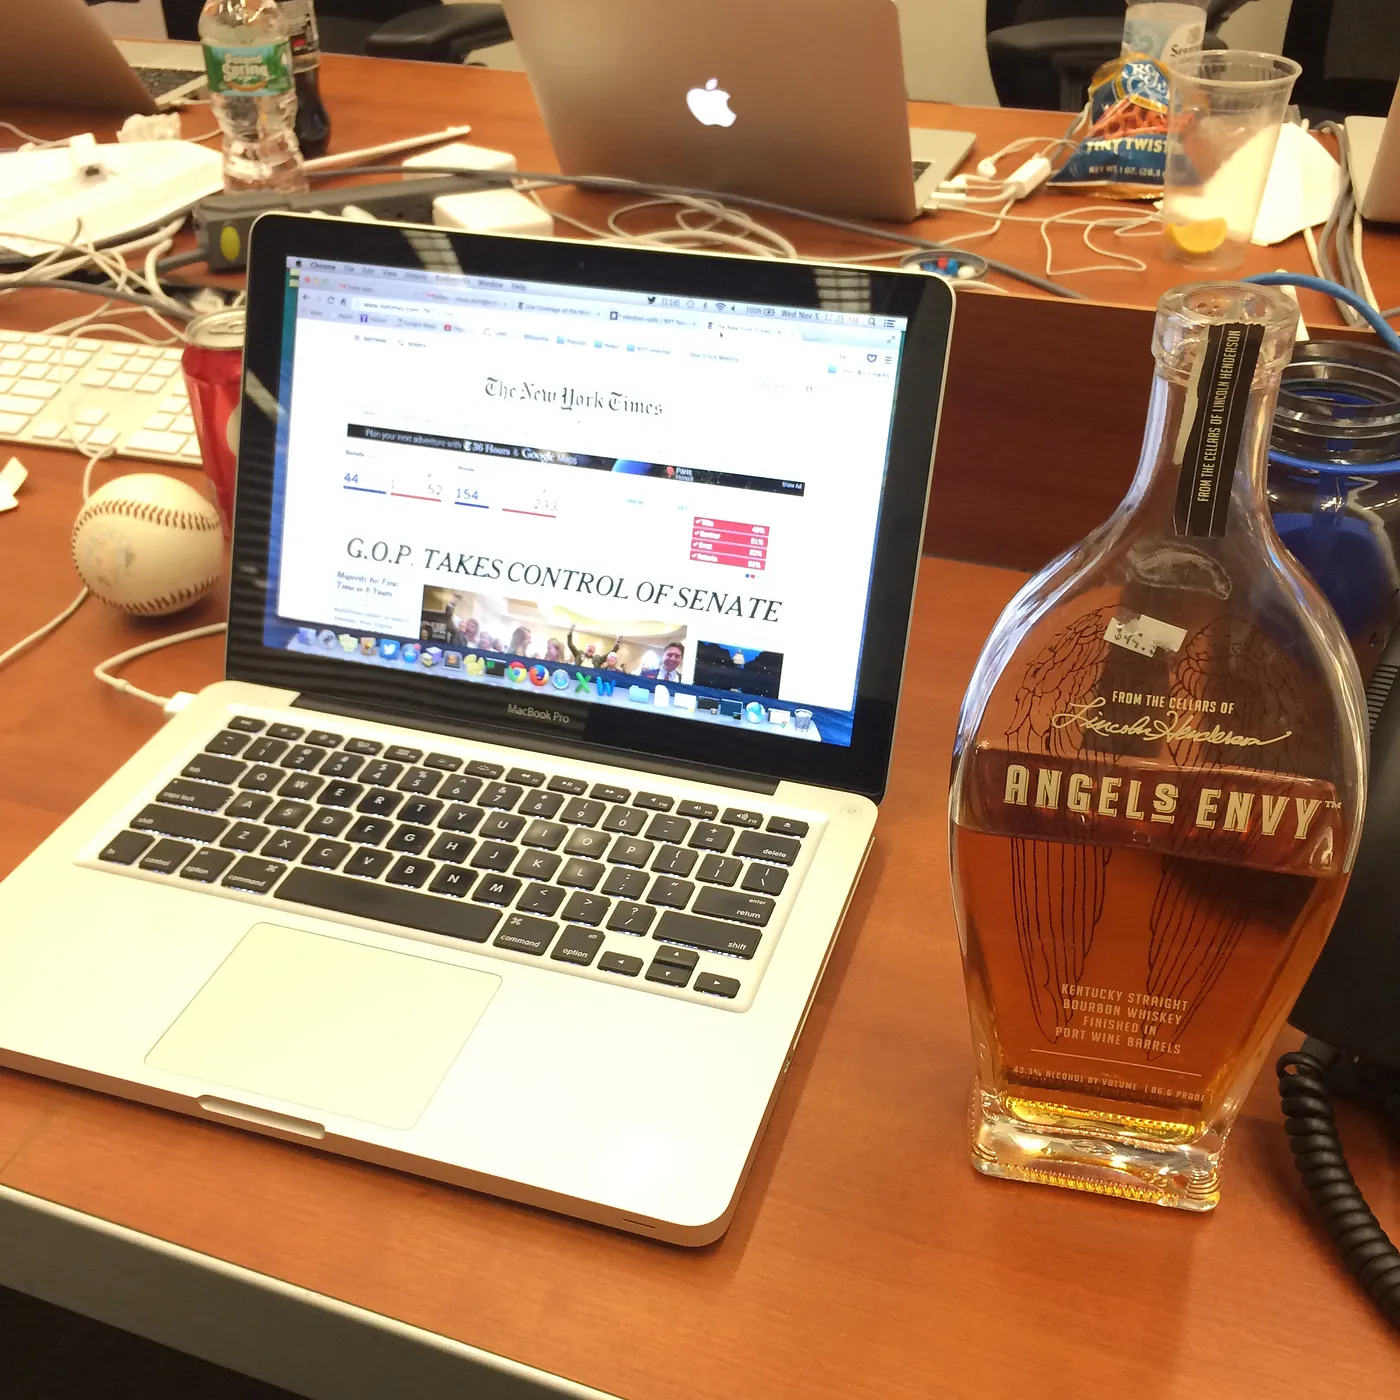
Elections
Probably my single most important project was the work I did on election results within the Times from 2008 to 2014. Funnily enough, despite my advocacy at a meeting, I wasn’t much involved with the coding work for handling the primaries in 2008. But in July 2008, I started pairing with Ben Koski on how to improve and revamp the loader for the general election. It was a great experience, and the resulting code was the basis of our election results collection and reporting for the next six years. For more details, see the project page for the [election loader]/projects/nytimes-election-loader.
Olympics
The other big data project was the Olympics. In 2009, we decided our next big data project would be ingesting Olympics data, both for our own purposes and as a revenue stream of licensed interactive components for other news organizations. The 2010 Winter Olympics were going to be in Vancouver from February 12 - 28, 2010 so we started working in the summer and fall of the year before. Honestly, this was the hardest project we ever did, and I don’t think we were entirely prepared for the amount of work we had in front of us before we arrived at the monumental task of ingesting Olympics data over 2+ weeks. We pulled it off for the most part, but there were a lot of frustrating moments and exhausting days. But, this work became the basis for other coverage of the 2012 Summer Olympics (London) and 2014 Winter Olympics (Sochi), among others.
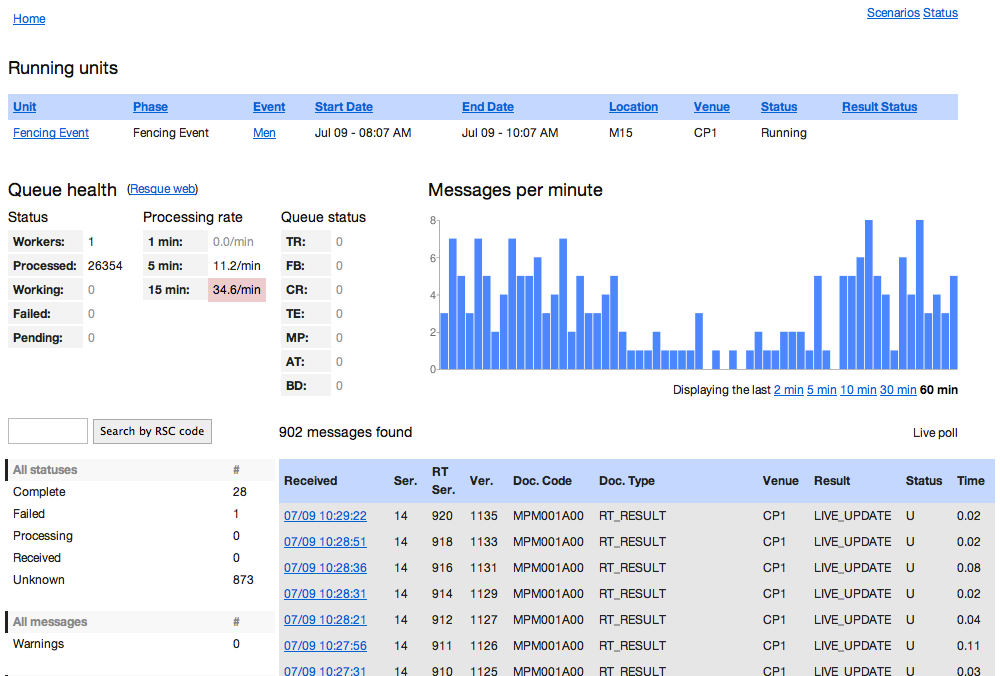
To understand why this was so challenging, you need to understand the Olympics data feed or ODF. To receive Olympics data, participating organizations set up a server which then receives a firehose of XML messages for every event while they are happening, including partial and full updates, roster communications, record notifications. Furthermore, each sport has its own specific customizations to the base message schema that you need to be able to parse and then you need to create visualizations for. For more details on the technical operation, read this excellent overview of the technology for the London Olympics 2012 by Jacqui Lough or this piece on all the audience considerations for the Olympics by Tiff Fehr.
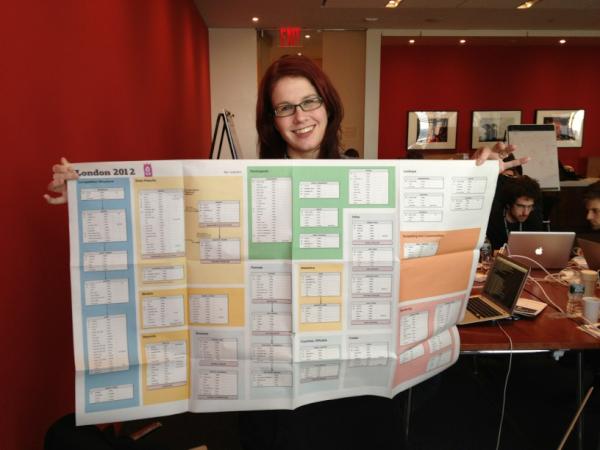
Besides the effort, I remember a lot of the silly moments. The jokes about our favorite mascots from Vancouver (Quatchi is the best!) and the creepy cyclopean mascots of London 2012. The comedic descriptions of unfamiliar horse in the Modern Pentathlon. The ludicrously large database schema (pictured above with Jacqui) needed to represent all the entities and their relationships to each other. I also remember that it was just physically exhausting, and I wound up with pneumonia from running myself so ragged. Elections only last one night, but an Olympics runs for several weeks.
Reader Input
Over the years, the Interactive Newsroom Team tried a variety of different experiments in collecting and presenting inputs from our readers. The earliest example of this was the Election Night Word Train which ran on Election Night 2008 and asked Obama and McCain voters to describe their mood in a single word. Another novel example was the 2009 feature Healthcare Conversations which grouped comments into various rooms with little figures of people to show where the current discussion activity was happening. This was also echoed in the feature “I Hope So Too” which collected reader comments about the Obama administration (but is now completely nonfunctional).
In a similar vein, we built an interactive tool for readers to submit photos related to Obama’s first inauguration in 2008. We later generalized this project into a generic tool for accepting and moderating uploaded photos from readers called PUFFY (Photo Uploader For You), which was then followed by another reworking of the application called STUFFY. That tool’s biggest moment was the “Moment in Time” project, where readers sent in more than 10,000 photos all taken at a single moment across the globe and stitched into an interactive graphic that let readers spin the earth and see the photos from a given area. Unfortunately, it also doesn’t work anymore, but it was pretty impressive at the time!
Document Dumps
As a newsroom team, we also would participate in important work driven by the news cycle. One early example of this happened in March 2008, when Hillary Clinton’s calendar during Bill Clinton’s presidency was released by the National Archives. After receiving scans of the documents, we spent a pretty frantic 24 hours building an online document viewer which allowed Times reporters to record annotations for readers to understand the context of important pages. This technical approach later became the basis for DocumentCloud, which is still in operation today.
Another application that I really wish were not still in operation is the Guantanamo Docket. Originally built out from data provided by Wikileaks, it has been supplemented and updated over the years to track the releases of various detainees that have been held at the prison. The application itself has gone through several major revisions, with different members of Interactive News contributing over the years. We thought it would only be in use for a few years. As I write this, there are still 9 detainees left in the prison. And so the app continues to run because it still fulfills its purpose.
Despite our skills, our team didn’t participate in as many journalistic projects as I would have hoped. All too frequently, we were invited in near the very end and asked to make an interactive when all the original reporting had concluded. One exception to this outcome was the Toxic Waters series by the investigative desk that looked at common pollutants in drinking water across the US. Interactive News contributed to the project with an interactive tool that let readers examine the pollution in their own drinking water; this data also helped to inform the reporting of the piece. Similarly, when the Times was given leaked war logs and interactive cables by Wikileaks, our team built out internal admins for reporters to search and read the data. I’ve put information about the Wikileaks project on its own page.
Silly Stuff
It wasn’t all breaking news and serious projects. We had a lot of fun working together and I miss the camaraderie of the team. We also sometimes would build silly things. I remember an April Fools project of a system for sending large files as 10,000s of tweets. We would sometimes crank up “Highway Through the Danger Zone” when it was time to do a deploy. I already mentioned Jeff Vader and his brother Chad. And we did silly projects sometimes like TimesHaiku. That too has its own separate page as a significant personal project to me.
When I left the Times, the team gave me for a sendoff a special Twitter account that commemorated all my most memorable commit messages (“This time it’ll work!” “Okay, this time!” “Dammit!”) as well as a framed photo of my now-revoked SSH key that I used to connect to servers. It was both silly and incredibly thoughtful at the same time. In other words, the perfect synopsis of how Interactive Newsroom Technologies operated.
Further Reading
- A talk I gave on data journalism for TimesOpen
- The New Journalism: Goosing the Gray Lady
- Talk to the Newsroom: Interactive News Collaborative
- The Journalist as Programmer, International Symposium on Online Journalism, Spring 2012
- Newsdev About-INT repo